

When studying machine learning, we often see the word “model”.
The word “model” is derived from English nuances, and even if you can understand it, it is difficult to explain in detail.
This article is mainly aimed at beginners in machine learning, and covers everything from the basics of “What is a model in the first place?” to the applied knowledge of “What is a good model?”
What is a model in machine learning
What is a model
A model in machine learning is something that, when there is some kind of input, evaluates the contents of that input in some way and outputs it as an output value.
Examples include a model for determining whether a received email is spam or a model for determining which product to recommend for certain customer data.
A model in machine learning refers to the algorithm of the machine learning process itself. A model can be viewed in terms of two algorithms: training and generalization.
For example, in order to determine whether a received email is spam or not, a model must first be “trained” using a large amount of email data.
But that’s not enough. The machine learning model will then have to determine whether new emails are spam as well. This is “generalization”.
In general, a model obtained as a result of learning using a dataset for a certain purpose (in the above example, spam detection) is called a “trained model.”
model type
Machine learning models can be roughly divided into two types: regression models and classification models.
The two have different purposes, the regression model is a model that predicts values, and the classification model is a model that determines which class a given data belongs to.
Regression model takes “continuous values” as input. Classification models, on the other hand, take “discrete values” as input. The simplest regression model for continuous values is a linear function of the form “Y = AX + B”.
This is called a “single regression”. A simple regression equation has one variable (here, X), but a regression equation with multiple variables, in other words, a regression equation that takes the form of an nth-order function is called a “multiple regression equation.”
Similar to regression models, classification models also have some distinctions.
Among the problems handled by the classification model, such as “pass or fail” and “spam mail or not” (strictly speaking, “A or not A” and “A or B” are different problems) The problem of determining which of two classes a certain data belongs to is called “binary classification”. Classification into more classes is called “multiple classification”.
Model performance evaluation
The model is “trained” using a dataset, but as a standard for exploring how “good performance” it is or how to correct it, the model creation In some cases, several “performance evaluations” are used.
For regression models
Typical regression model performance metrics include RMSE, MAE, and R2. By putting the actual value (observed value) and the predicted value of the target data in the formula of each evaluation metric, it is judged how good the prediction is.
When evaluating the performance of an actual regression model, not only one evaluation index but also multiple evaluation indexes are used to perform multifaceted analysis as much as possible.
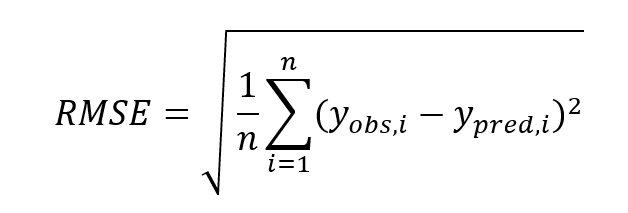
Root Mean Absolute Error (RMSE)
The closer the observed and predicted values, the smaller the RMSE. Actually, it’s not that simple, but it can be said that the smaller the RMSE, the better the model.
The disadvantage of RMSE is that it is susceptible to outliers (or outliers) because it contains “(difference) squared” in the formula as shown below. Evaluation indicators with similar characteristics include “mean squared error (MSE)” and “coefficient of determination (R2).”
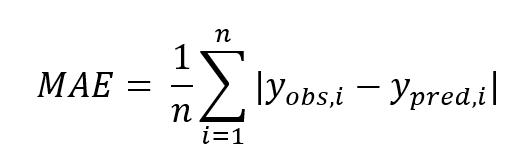
Mean Absolute Error (MAE)
MAE is an evaluation metric that overcomes the shortcomings of RMSE to some extent. The “(difference) squared” part of the RMSE has been replaced with an absolute value.
This makes the evaluation robust against outliers. An evaluation metric with similar characteristics is “Huber loss,” which combines MSE and MAE.
Root Mean Square Logarithmic Error (RMSLE)
RMSLE is a metric that overcomes the shortcomings of RMSE in a different way than MAE. By adopting log, we avoid the “(difference) squared” notation.
For classification models
When thinking about simple binary classification, if the judgment that belongs to the class you want to discriminate is positive and the judgment that belongs to the other class is negative, the result of 4 patterns is obtained by combining the positive/negative of the observed value and the positive/negative of the predicted value. It is possible.
True positive with positive observed value and positive predicted value, True Negative with negative observed value and negative predicted value, False positive with negative observed value and positive predicted value , False Negatives where the observed value is positive and the predicted value is negative.
The expression of these four patterns in a matrix is called a confusion matrix.
| Observation is positive | Negative observation | |
| positive predictor | True positive (TP) | false positive (FP) |
| Negative predicted value | false negative (FN) | true negative (TN) |
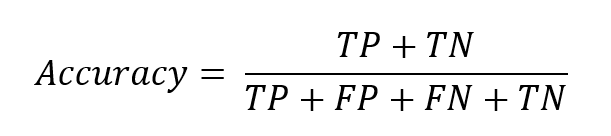
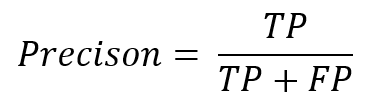
This mixture matrix is used to evaluate the classification model. There are five typical evaluation indices: accuracy rate, precision rate, recall rate, specificity rate, and F value.
Accuracy
Accuracy rate simply indicates the percentage of correct predictions out of all data.
Precision/Precision
Precision indicates the percentage of data with positive predicted values that actually have positive observations. This is often called “accuracy”.
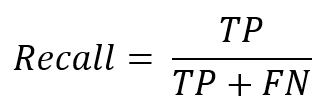
Recall rate
Recall indicates the proportion of positive predicted values out of positive observed values. This is sometimes called “Sensitivity”.
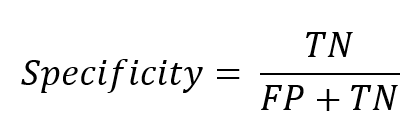
Specificity
Singularity is the percentage of negative predicted values out of the actual negative observed values.
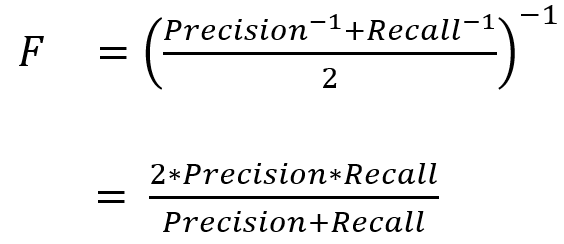
F-measure
Classification models are often evaluated using the “F-measure”, which is the harmonic mean (reciprocal of the reciprocal mean) of precision and recall.
Criteria for selecting a good model | Various indicators
Based on the above performance evaluation, we will update the model to a better one. The model needs to change the evaluation metric it emphasizes depending on the purpose and situation.
Accuracy and recall are trade-offs
There is a trade-off between precision and recall. In other words, if one number goes up, the other number goes down.
Also, by using the “F value” explained above, both high accuracy and recall can be achieved. The F value is the harmonic average of precision and recall, so if you adjust the model so that the F value is maximized, you can achieve a good balance between precision and recall.
A model with 100% accuracy is dangerous!
However, the higher the performance rating, the better. . For example, if a model has a precision of 100%, it may indicate that it is overfitting.
Overtraining
If the accuracy is very close to 100% or the correlation coefficient is very close to 1, it is a “too good” performance evaluation. Overfitting is a phenomenon in which the accuracy of unknown data decreases due to overexplaining the training data.
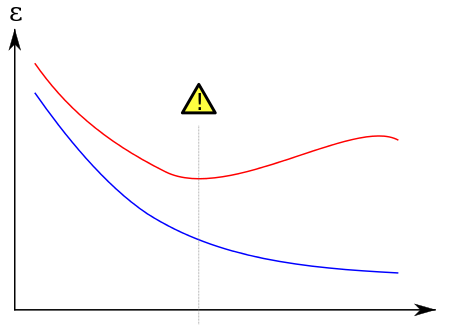
In the figure above, red indicates errors on the training data and blue indicates errors on the unknown data. While the error on the training data is decreasing, the error on the unknown data increases along the way. This is overlearning.
Generalization performance
Overfitting occurs when the “generalization performance” becomes sparse. A model with high generalization performance is a model that can show similar accuracy to unknown data as training data.
In general, the expressiveness of a model is defined as how well it can explain the training data. There is a trade-off between expressiveness and generalization performance.
There are several ways to prevent overfitting, one of which is cross-validation.
cross-validation
In k-fold cross-validation, the dataset is first divided into k parts, one of which is used as test data and the rest as training data for training and evaluation.
Do this for all combinations (k ways) and calculate the average performance.
This increases the amount of computation, but achieves higher generalization performance even with less data. Therefore, the smaller the amount of data, the more likely overfitting will occur.
By using cross-validation, it is possible to obtain more stable results.
Explainability / Interpretability
Evaluation indicators are objective and numerical performance evaluations, but more subjective performance evaluations are actually required.
The “explainability / interpretability” of a machine learning model refers to how well humans can understand the results of machine learning.
No matter how good the results of machine learning are, if humans cannot understand the process and results, there will be inconveniences when actually using the results.
For example, if a machine learning model that determines what a patient’s illness is can only conclude that “I can’t explain why it was determined that way, but for the time being, you have a disease called XX”, that is practical machine learning. Can you say model?
AI black box problem
The above concerns are said to be the AI black box problem.
A model that cannot explain “why a decision was made” or “what process led to that conclusion” creates a variety of problems.
For example, there is an ethical issue of what responsibility will be when a black-box AI causes medical malpractice.
Explainable AI / Explainable AI
Explainable AI is proposed to realize AI that solves such AI black box problems.
The “Explanable AI” service announced by Google in November 2019 can clearly show which features and factors contribute to the prediction results of machine learning models.
In this way, for a machine learning model to be a “good model”, it is not enough just to have a good objective performance evaluation value, and explainability is very important when actually using a machine learning model. It’s an indicator.
summary
This article was mainly aimed at beginners in machine learning and dealt with the questions “what is a model” and “what is a good model”.
The types of models and metrics covered in this article are just basic ideas, so interested readers can explore further.
This article also introduced a non-numerical model evaluation criterion called explainability.
There is still a lot of discussion about what kind of inconvenience the black box problem of AI will cause and how to prevent it.
This is a problem that requires literacy on the side of using AI, so it will be necessary to follow the discussion carefully.
