Many people are already using SNS ads such as YouTube, Facebook, and Twitter in addition to banner ads, display ads, and listing ads.
But are you measuring and analyzing the effectiveness of all that advertising?
The role of web advertising is not just for users to click and convert. From increasing brand awareness to generating interest in products and services, advertising fulfills its respective role according to the customer journey of each individual consumer.
By measuring the effectiveness of these various types of web advertising, it becomes possible to see which advertising media and how much budget can be invested in to obtain the greatest return (= profit) . That is ad attribution analysis .
In this article, we will explain the attribution analysis method and analysis model, and point out how to use the analysis report.

Table of Contents
- What is attribution analysis? Why do you need attribution analysis?
- To advance the attribution analysis
- Learn the characteristics of 8 attribution models and find the best model for your business
- Take advantage of attribution reports
- How to use Google Ads attribution reports
- How to use the Google Analytics Attribution Report
- How should we proceed with attribution analysis in the future?
- summary
What is attribution analysis? Why do you need attribution analysis?

The verb form of attribution, “attribute”, is a word used to say “I think something is to blame” for an event.
In the financial industry, “attribution analysis” has been used as a multifaceted method for analyzing “what contributed to the overall return?” Over time, this technique has also been applied in the field of advertising and marketing.
First, let’s check the basics of attribution analysis used in advertising and marketing.
What is Attribution?
“Attribution analysis” in the advertising and marketing industry is to identify the advertisements that the user has come into contact with until conversion based on the history and analyze the contribution of each advertisement. Let’s use an easy-to-understand example to explain the flow of analyzing the contribution of each ad.
In Japan, the Rugby World Cup in 2019 was very exciting. In addition to the success of the Japanese players, many people were fascinated by the fun of rugby, where the forwards collided and secured the ball on the front line, and the backs received the ball to score a try. think.
Modern advertising is also very similar to rugby attack. Many advertisements such as listing advertisements, display advertisements, blogs and Facebook are working together to create a single flow until one prospective customer converts (raises a try).
If you were the manager of a rugby team, you would be following the movements of each player in detail. If there is a player who is strong in offense, I think, “Let’s build an offense centered on this player.”
Attribution analysis is exactly the same. Attribution analysis is used to analyze the effect of individual advertisements in the flow leading to “conversion”, identify advertising media that should be focused on and media that should be reviewed, and formulate a more effective advertising strategy. do.
Some people may think, “Without such troublesome things, if you use an analysis tool, you can immediately find out where the last click (the click before conversion) that was the decisive factor for conversion came from.” For such people, I would like you to take a look at the following data.
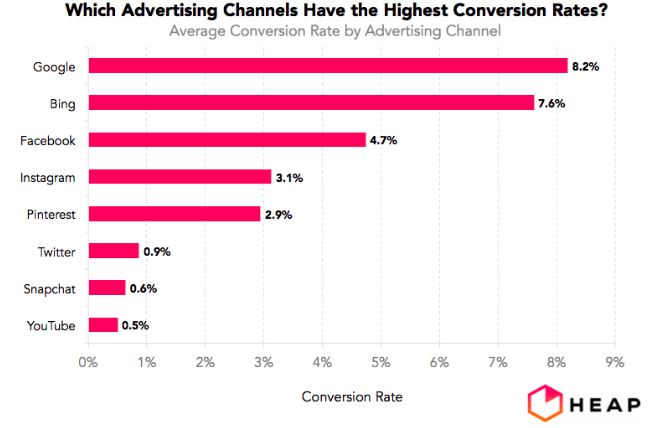
The graph above shows data analysis firm Heap Inc., which analyzes access to over 5 million websites for e-commerce businesses. Is it?” is the survey result.
The horizontal axis is the conversion rate. This chart shows that most people convert from ads on search engines like Google (8.2%) and Bing (7.9%).
But consumers don’t just convert straight from search. There are many people who see an advertisement, visit a website from there, compare various products, and convert. Looking at the advertising channels that drive traffic to your website, the top performers are different from their conversion rate ranks.
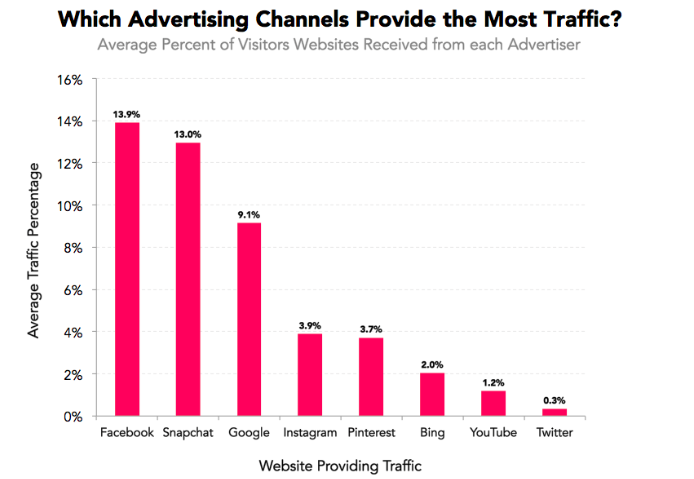
The vertical axis of this graph shows the percentage of average traffic (visits) flowing from the advertising channel to the website. 13.9% from Facebook to the website, 13.0% from Snapchat to the website, indicating that it is accessed at a higher rate than the Google search site.
The above data is e-commerce statistics, and the purchase amount was also subject to items under $ 1,600. In the case of such products, the consideration period before purchase is short, and the advertising channels that consumers are exposed to are limited.
However, in the case of more expensive products and services, and BtoB, which requires consideration by the entire company before purchasing, the process to purchase becomes even more complicated.
Next, let’s take a look at how many consumers who are considering buying a car have contact with digital content, including advertisements, from the time they consider it until they make the decision to purchase it.
Consumers touch digital content an average of 900 times in the three months before purchasing a car
Consumers who buy durable goods don’t make a purchase decision after watching a single ad. When they feel the need, they often take the initiative to gather information.
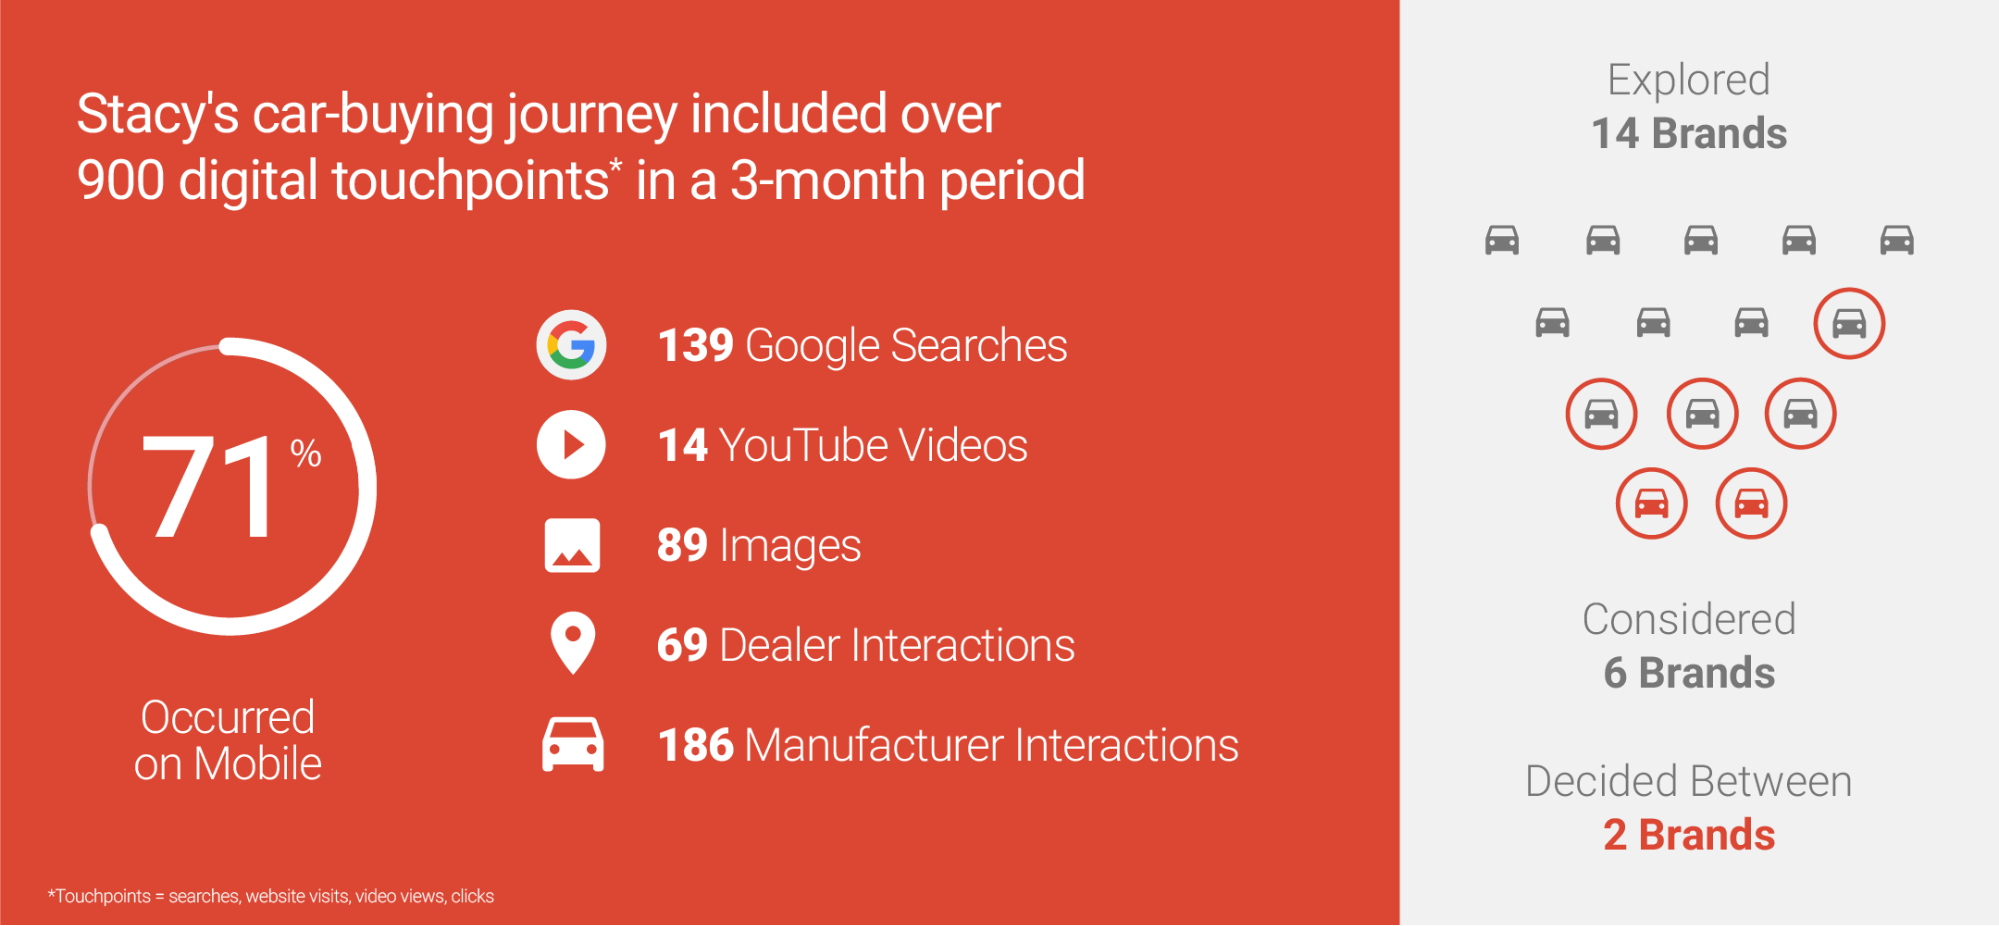
Based on the clickstream (data that records how a user who visited a website navigated from page to exit), Google decided to purchase a car and actually purchased it. We clarified the behavioral model for 3 months until doing.
- 3 months of exposure to digital content (including browsing sites or ads, clicking or swiping ads, watching video ads, or making inquiries) for the purpose of purchasing a car 900 times with
- Contact is mobile 71%
- Googled 139 times
- 14 YouTube videos watched for purchase
- The number of times the image was viewed for purchase was 89 times
- 69 contacts with the dealer
- 186 contacts with manufacturers
- 14 car brands were initially nominated
- 6 stocks considered
- Two stocks were considered
As long as you have this many contacts, you can’t judge that the ad just before conversion was “effective”. “Last click before conversion” alone is not enough to assess “which ad channels are working”.
Similarly, many digital contents are considered for B2B products, where many people are involved in purchasing decisions and a large amount of money is invested. It wasn’t just one ad channel that influenced long-converting consumers, but a variety of channels.
In particular, SNS, which provides direct contact between companies and customers, is rapidly spreading, but there is currently no tool that can accurately measure the effect of SNS on revenue. However, if you introduce attribution analysis, you will be able to measure the effect of SNS as well.
SNS cannot be evaluated if the effect is measured only by the last click
If we only focus on the last click and analyze the advertising effect, we will ignore the advertising effect of content marketing on SNS such as Facebook, Snapchat, Instagram, and websites.
According to the statistics of Statista, which provides online statistics, SNS is estimated to have 2.82 billion people worldwide, and among them, Facebook, the largest user, exceeds 2.41 billion people according to statistics in August 2019. Masu. The overwhelming majority of users come into contact with companies on a daily basis through SNS such as Facebook. is clicked).
Using traffic analysis, you can find out which ad or web page was viewed just before conversion, but besides that page, you also need criteria to evaluate which ad channels are having an indirect effect . One of the purposes of attribution analysis is to measure the effect of SNS, which is difficult to measure with normal methods.
To advance the attribution analysis

Before actually starting attribution analysis, explain what kind of companies are suitable for attribution analysis and what kind of preparation is necessary to actually introduce attribution analysis To do.
Who Needs Attribution Analysis?
If the product you are dealing with is something like daily necessities with little time to consider before purchasing, even if you don’t use attribution analysis, the contribution of the advertisement can be measured by history and A/B tests (two things). can be grasped by a test that compares
However, the following companies need to introduce attribution analysis and optimize their investments.
- Consideration period of products and services provided is long, and prospective customers come into contact with advertisements, SNS, and websites many times
- Consider using campaigns with large advertising budgets on multiple channels
- Double costs frequently occur due to conversion using multiple advertising channels
- Aiming for branding and awareness expansion through SNS and content marketing, confirming the effectiveness of SNS and blogs
What to prepare before introducing attribution analysis
Now let’s talk about the necessary preparations before actually implementing attribution analysis.
Step 1. Data collection
Attribution analysis is based on data. For that reason, we collect data such as the media and budget that are placing advertisements. In addition, prepare data (CPA, number of conversions, etc.) of media that you have posted so far, such as display advertisement data, search advertisement data, video advertisement, native advertisement, etc.
Step 2. Consider which attribution model to use
Attribution analysis is done using models. Real user behavior differs from person to person and from company to company, and follows a complex path. You’ll be able to pinpoint results relationships and set future directions.
Step 3. Decide on a tool for attribution analysis
The purpose of attribution analysis is not to visualize the contribution of each advertising channel to conversions, but to optimize advertising investment based on the obtained analytical data. Therefore, it is important to create reports based on attribution analysis. If you install the tool, it will automatically create reports with multiple attribution models.
Attribution reports can be created using tools such as Google Ads, Google Analytics, and HubSpot.
Learn the characteristics of 8 attribution models and find the best model for your business

Attribution analysis estimates the ROI (return on investment) of each touchpoint until a single conversion is achieved. Generally, ROI is calculated by the following formula.
ROI = (number of conversions x average profit per profit – cost) ÷ cost x 100 (%)
However, this formula can only determine the ROI of the entire ad. Therefore, if you decide in advance the contribution ratio of SNS, email, and website out of one conversion, you can calculate the ROI for each point of contact.
An attribution model is a model of “how to allocate” the degree of contribution of each point of contact. There are a number of different ways of thinking, such as the model that the first point of contact a user has has the greatest contribution to conversion, or the model that each of the various points of contact contributes equally.
Therefore, we will assign a contribution level to each channel in common so that the total will be 100%. The point of contact is the starting point of conversion on the left end, and the point of contact immediately before conversion on the right end, and set the channel along the customer journey.
From now on, I will introduce the following 8 attribution models.
- First-click attribution model (*)
- Last click attribution model (*)
- Linear attribution model (*)
- contact attribution model
- Attenuation attribution model
- Full pass attribution model (*)
- U-shaped attribution model (*)
- W-type attribution model (*)
* is an attribution model available in HubSpot
Let’s check the features of each model.
First click attribution model
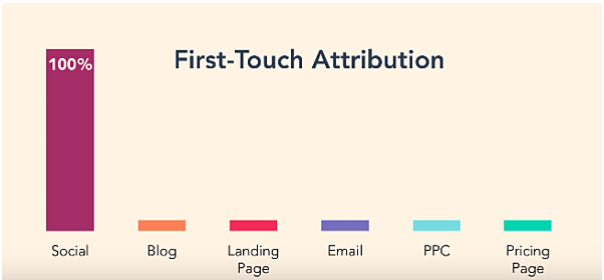
In the graph, the contact points that users follow to conversion are arranged in order from the left: SNS, blogs, landing pages, emails, PPC (pay-per-click advertising), and price pages.
This model judges that the customer’s first point of contact contributed to conversion. If you are actively using SNS, you can measure the contribution of SNS through this analysis.
This model is also used because the first click is important when campaigning to less aware users.
Last click attribution model
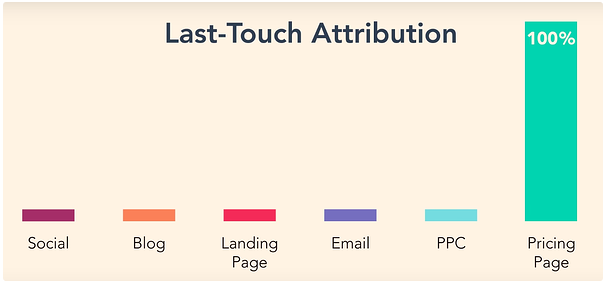
It is also a conventional evaluation method, which judges that the ad that the customer clicked last contributed to the conversion.
For example, this model is often used for analysis when conducting a limited-time campaign. It is also used when comparing the first click and the last click.
linear attribution model
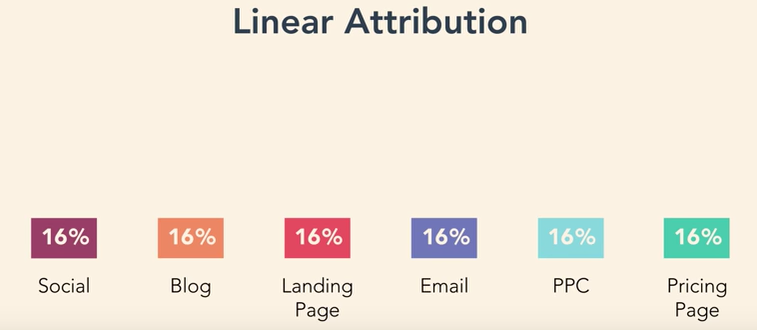
It is a model that assumes that all the advertisements that the customer touched contributed equally to the conversion. This is the model for you if you consider customer touchpoints to be important throughout the sales cycle.
contact attribution model
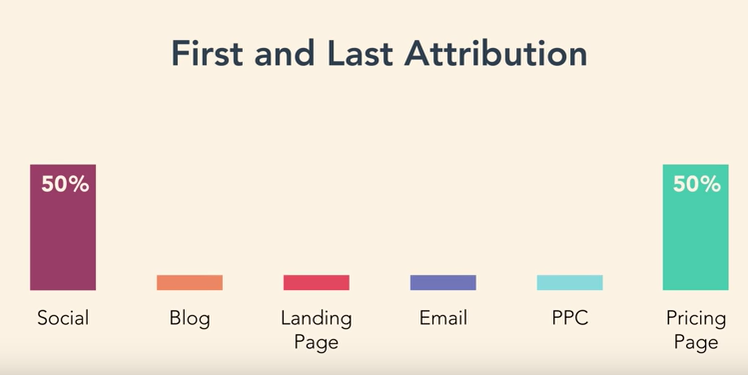
A model that distributes contributions to the starting and ending points leading up to conversion. Here, 50% is allocated to the beginning and the end, but there is also a method of reducing it to 30% each and allocating 10% to the points in the middle.
Use this model if you want to focus on the channels that first brought your customers to your brand and the last ones that converted.
Attenuation attribution model
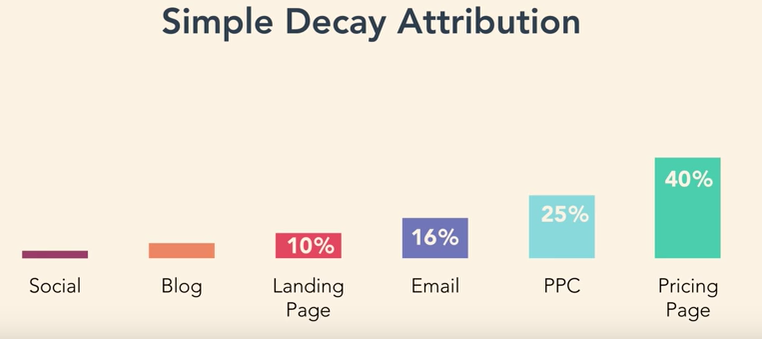
We consider that all points of contact leading up to the customer’s conversion have a contribution, but we judge that the last ad touched made the greatest contribution, and set it so that the degree of contribution decreases as time goes back.
This model is suitable for products with a relatively short review period in the sales cycle.
Full pass attribution model
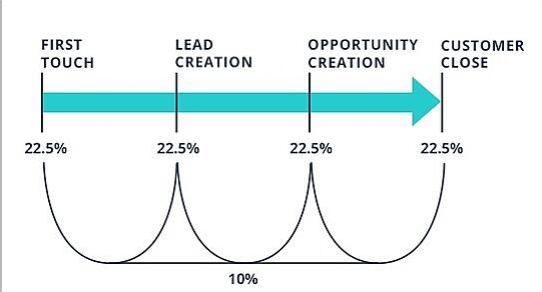
The full-pass model is based on prospective customers contacting companies through SNS, websites, events, searches, CTAs, etc. Create 4 contacts, “Contact” and “Order”. We then assign 22.5% of the contribution to each of the four contacts, and distribute the remaining 10% of the contribution evenly among the contacts between each contact.
The full-path attribution model is the most comprehensive model, requires a lot of data, but is considered to be very effective. This model is often used when the user life cycle is long.
U-shaped attribution model
Similar to the full path, U-type also creates four points of contact for prospective customers: “first contact”, “lead contact”, “opportunity creation contact”, and “order”. 40% each, and the remaining 20% is split evenly at the midpoint junction. It is a model that emphasizes the user’s “entrance” and “exit”.
W-shaped attribution model
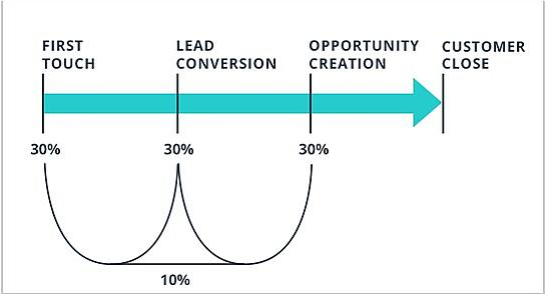
As with the full pass, the W type also creates four points of contact for prospective customers: “first contact”, “lead contact”, “opportunity creation contact”, and “order”. Allocate 30% to each of the 3 “problem creation”, and divide the remaining 10% evenly at the point of contact at the midpoint. This model has a long user life cycle and emphasizes “lead contact”.
The results will be different depending on which model is used for the analysis.
The results of attribution analysis differ depending on which model is used. See below for an example of how different it can be.
Adobe used both first-click and last-click attribution models for e-commerce websites to calculate revenue per user.
The blue graph is the revenue per customer calculated using the first click attribution model. The green graph is the revenue per customer calculated using the last click attribution model.
Looking at Facebook, revenue per customer is $1.13 under the first-click model, compared to only $0.6 under the last-click model.
In this way, the results will vary greatly depending on which analysis model is used, so what do you want to analyze? Depending on what you want to know, it would be a good idea to try various analysis models. Also, using multiple models for attribution analysis is very effective, and comparing first-click models to last-click is a common technique.
Take advantage of attribution reports

We’ve covered attribution analysis from many different angles. Some of you may think, “I understand that attribution analysis is important, but assignments and contact points seem to be very difficult.”
However, with an attribution analysis tool, you can automatically create an attribution report in no time by simply selecting a model and making a few settings.
Attribution reports come standard with free Google Analytics, and if you use Google Ads, Google Ads also has the ability to create attribution reports.
You can also create attribution reports in HubSpot. Now let’s see what the generated attribution report tells us.
CPA (customer acquisition cost) for each channel from attribution analysis
The contribution score assigned to each channel based on the attribution model is called the attribution score.
For example, let’s say we use a linear model and assign 20% to each of the 5 channels. Based on that attribution score, you can calculate your attribution CPA.
Regular CPA can be calculated by “CPA = advertising cost ÷ number of conversions”, but attribution CPA can be calculated by the following formula.
Attribution CPA = ad spend spent on that channel / attribution score
By giving an attribution CPA, you can rank which channels are most efficient, which channels are second most efficient, and so on.
Number of leads generated from blog content
Attribution reports give you information on whether users clicked on your blog post before conversion. You can also measure the effectiveness of your blog through attribution analysis.
More and more companies are focusing on content marketing. However, without attribution analysis, it is impossible to see how effective blog content is and whether it is useful for nurturing prospective customers.
By measuring the effects of blogs and SNS, you will be able to deliver more appropriate content that suits your users.
Channels generating the most leads
Attribution reports help you understand the steps users take and the pages they visit during the conversion process, so you can find out which channels are generating the most leads.
For example, if you know that email marketing is getting you more leads with less effort, you can shift your priorities there.
Behavior of non-converting users
By comparing the behavior of users who converted and those who did not, you can understand the behavior of users who just browse websites, SNS, and blogs.
Not only can you analyze the keywords and suggestions that attract them to convert, but you can also identify channels and content that are not conducive to conversion. Cut spending where it’s not needed and reallocate budget to more effective channels.
How to use Google Ads attribution reports

If you use Google Ads, you should consider using attribution.
In Google Ads, you can set up attribution reports from “Search Attribution”.
Google Ads Attribution allows you to create attribution reports with the following 6 models.
- Last click model (default)
- First click model
- linear model
- Attenuation model
- Contact base model
- data driven model
A “data-driven model” is a model that can be used when there is sufficient historical conversion data. Based on past data, this model determines which point of contact contributed the most and assigns the contribution to each channel.
By using the Google Ads Attribution Report, you can track how your ads contributed to conversions. Here are 5 things you can learn:
- Shows the number of conversions from ad-assisted clicks as well as last clicks
- See not only the ads clicked, but also the number of times the ad was viewed before conversion
- See which ads users took action on before they converted, and which devices they used in the process
- Used in conjunction with Google Analytics
- Optimize your bids through attribution analytics, an exclusive benefit of Google Ads
How to use the Google Analytics Attribution Report

Google Analytics, a free analysis tool, also has an attribution function. If you are already using Google Analytics for analysis, etc., you can immediately start attribution analysis from [Attribution] displayed on the left sidebar of the analytics report screen.
A major feature of Google Analytics is the ability to perform attribution analysis using a model comparison tool. There are seven types of attribution analysis models available in Google Analytics.
- Last click model
- First click model
- linear model
- Attenuation model
- Contact base model
- Last indirect click (allocate 100% of the contribution to the last channel the user clicked on before converting)
Google Analytics has a model comparison tool that allows you to compare and use up to three models.
In the beginning, it is a good idea to get used to the analysis by comparing the last-click model, the first-click model, and the linear model.
Which channel is most effective in the last-click model, and which is most effective in the first-click model compared to the linear model, which actually impacts users by comparing to… I can see the channel.
How should we proceed with attribution analysis in the future?

Attribution analysis isn’t just about visualizing which channels are contributing to conversions. Now let’s talk about how to use the results of your attribution analysis and reporting.
Reallocate with Attribution Management
Most importantly, optimize those channels by spending more of your advertising budget on the channels that are driving the most conversions and lead generation.
In addition, identify underperforming channels to not only reduce budgets, but also consider how they can be improved to reach users.
Improve your conversion rate
Many companies still focus only on channels directly related to conversions. Such companies only advertise on listing ads.
However, if you turn your attention to the channels that are producing indirect effects by utilizing attribution analysis and carry out combined advertising and marketing activities, conversions should definitely increase.
Attribution analysis cannot produce results immediately after it is introduced, but by creating a media plan using multiple media and cultivating new channels while avoiding risks, in the medium to long term It should lead to improved conversion rates.
Create attribution reports with HubSpot
Once you’ve created your attribution reports in HubSpot, you can associate them with your contacts in HubSpot’s CRM. Associate attribution reports with specific personas, groups of contacts, lifecycle stages, business categories, and more.
By doing so, you can get a detailed understanding of how the registered prospects are interacting with the content, and you can use the attribution report to make suggestions to the prospects.
summary

Advances in ad technology have made everything measurable. Where once converting customers could only know where they came from, now they can track every medium they interact with.
On the other hand, the evolution of ad technology has also brought about changes in user purchasing behavior. Today’s users interact with social media, advertisements, and websites hundreds of times before making a purchase.
The company not only raises brand awareness through various digital contents such as SNS, blogs, advertisements and videos, and provides users with information about products, but also makes users aware of the problems they face. It has come to play a multifaceted role of presenting solutions and empowering.
Attribution analysis will undoubtedly play a central role in advertising and marketing activities in the future, in order to deliver the necessary information to the people who need it and to provide a better customer experience.