A BI (business intelligence) tool that can perform complex analysis of various data. There are both paid and free BI tools.
When choosing a BI tool, it is risky to introduce an expensive tool without knowing what functions it has and what benefits it will bring to your company. First of all , by actually trying multiple functions with the free tool, you will be able to determine which functions you need and which you do not need .
In this article, we will introduce 13 recommended products, including free BI tools. We have also prepared a list that summarizes the features of each tool, so please use it as a reference for choosing the perfect tool for your company.

Table of Contents
- Advantages and disadvantages of free BI tools
- Important points when choosing a free BI tool
- [Free version] 7 recommended BI tools
- [Paid version] 6 recommended BI tools
- Let’s verify the functions you really need with a free BI tool
Advantages and disadvantages of free BI tools

First, let’s compare the advantages and disadvantages of free BI tools.
| ADVANTAGES OF FREE BI TOOLS |
|
|---|---|
| Disadvantages of free BI tools |
|
I will explain the advantages and disadvantages of each.
Advantages of free BI tools
The biggest advantage of free BI tools is that you can easily try out the standard functions of BI tools .
Most free BI tools come with built-in dashboards and automated reporting, so you can test them before committing to a paid tool.
After using a free BI tool for some time, you can sort through the features you need and the ones you don’t. If you think that the functions of the free BI tool are sufficient, you should continue to use the free BI tool as it is, and if there are insufficient functions, switch to a paid tool.
When proposing the introduction of a BI tool to your boss or a person in charge in another department, it is effective to actually use the free tool and appeal its usefulness.
Disadvantages of free BI tools
Free BI tools may have limited functions such as OLAP (real-time analysis of multi-dimensional data) and data mining. Also, if you are developing a free plan, you need to be careful because the period of use may be limited.
Depending on the tool, there are restrictions such as “knowledge of the source code is required” and “user support is not available”, so be sure to check before installing.
Paid BI tools make initial settings and API linkage easy, and often offer extensive support.
Important points when choosing a free BI tool
Before choosing a BI tool, keep the following points in mind.
[Clarify the purpose of introduction]
It is important to clarify the purpose in advance so that no one will use the tool even though it has been introduced . After interviewing management and on-site personnel, set a specific purpose, such as “to integrate data between departments and make it easier for managers to understand the on-site situation.”
[Choose a tool with an introduction form that suits your company]
There are three types of free BI tools: the “on-premise type” that you download and use, the “cloud type” that you can use on the web, and the “open source type” that is available online for free. It is important to understand the characteristics of each type and select the appropriate type.
- On-premise type: Operation and management is time-consuming, but you can build security that relies on your own server.
- Cloud type: Lacks customizability, but can be easily introduced and operated.
- Open source type: Advanced programming skills are required, but it is highly customizable.
[Free version] 7 recommended BI tools

Here are 7 free BI tools we recommend.
| NAME | PAID VERSION | MAIN FUNCTION | MODE OF INTRODUCTION |
|---|---|---|---|
| Google Data Portal | none | Automated reporting Dashboards Google account integration Collaborative editing |
Cloud |
| Microsoft Power BI | can be | Automated Reporting Dashboard Collaborative Editing* API Integration* AI Analytics* |
On-premises cloud |
| Qlick Sense | can be | Automated Reporting Interactive Dashboards API Integration * AI Analytics * Single Sign-On * |
On-premises cloud |
| Zoho Analytics | can be | Automated ReportingDashboardData ConnectorWhat -if Analysis |
On-premises cloud |
| Pentaho | can be | Automated Reporting Dashboards OLAP Analysis Data Mining |
Open Source |
| Metabase | can be | Dashboard OLAP Analysis SQL Interface Query Builder |
Open Source |
| Grafana | can be | Dashboard data source linkage user management |
Open Source |
*Available only in paid version
Google Data Portal
A completely free BI tool provided by Google. You can use the basic functions of BI tools such as the “dashboard function” that displays the aggregated results of data on the screen and “automatic reporting” that can generate easy-to-read reports from the analysis results.
It is also a feature that you can link with various Google services with one Google account . There are about 400 types, including Google Analytics, spreadsheets, and MySQL. By using Google Drive, you can save the report output on Drive and share it with others.
| PAID VERSION | NONE |
|---|---|
| Main function | Automated reporting Dashboards Google account integration Collaborative editing |
| Mode of introduction | Cloud |
Microsoft Power BI
Power BI is a BI tool provided by Microsoft. It is highly compatible with the company’s Excel and Dynamics, and data can be aggregated and analyzed in a simple procedure. In addition, it can be linked with hundreds of other tools, including SalesForce.
The operability is similar to that of Excel, and data analysis using functions is also supported. It is also attractive that you can easily move to the paid version with abundant functions just by changing the plan. Created reports are automatically updated to the latest status based on daily aggregated data, so there is almost no effort required for operation.
| PAID VERSION | POWER BI PRO: 1,090 YEN/MONTH/USER POWER BI PREMIUM: 2,170 YEN/MONTH PER USER CAPACITY UNIT 543,030 YEN/MONTH* * AVAILABLE WITHOUT PER-USER LICENSE |
|---|---|
| Main function | Automated Reporting Dashboard Collaborative Editing* API Integration* AI Analytics* |
| Mode of introduction | On-premises cloud |
*Available only in paid version
Qlick Sens
With Qlick Sense, you can easily change the analysis axis, which solves the problem of being unable to discover insights because it is difficult to change the viewpoint of analysis, which is common in conventional BI tools . For example, when analyzing sales data, you can switch the analysis axis such as “by prefecture” or “by product” in any order. This makes it possible to grasp the relationship between data at a glance.
The advantage is that the free period is long, and you can use the functions of the Business plan as much as you want for 30 days after applying. Because it supports simple and intuitive operation, even those who do not have specialized skills can use it.
| PAID VERSION | BUSINESS PLAN: $30/MONTH (APPROXIMATELY ¥3,400) ENTERPRISE PLAN: INQUIRE |
|---|---|
| Main function | Automated reportingInteractive dashboardAPI integrationAI analyticsSingle sign-on |
| Mode of introduction | On-premises cloud |
Zoho Analytics
Zoho Analytics is free for 15 days in the cloud version. The on-premise version will be free forever by choosing a personal plan. Even with a completely free on-premises (personal plan), the advantage is that you can use various functions such as over 250 types of data linkage, reporting, and predictive analysis .
Zoho offers a wide range of products that lead to the digitalization of companies, so it is characterized by its strength in series collaboration. If you are using Zoho CRM or Zoho Marketing Automation, which are products of the same brand, let’s analyze data efficiently by linking with Zoho Analytics.
| PAID VERSION | [ON-PREMISE VERSION] PROFESSIONAL PLAN: 3,600 YEN PER MONTH [CLOUD VERSION] |
|---|---|
| Main function | Automated ReportingDashboardData ConnectorWhat -if Analysis |
| Mode of introduction | On-premises cloud |
Pentaho
An open source BI tool equipped with advanced simulation functions. Adopting AI and machine learning technology, it can display various simulation results such as clustering, principal component analysis, and random forest.
There is a free “community edition” and a paid version “enterprise edition”. The free version has basic features such as automatic reporting and dashboards, but if you need customer support, the paid version is recommended.
| PAID VERSION | ENTERPRISE EDITION: INQUIRE FOR PRICING |
|---|---|
| Main function | Automated Reporting Dashboards OLAP Analysis Data Mining |
| Mode of introduction | Open Source |
Metabase
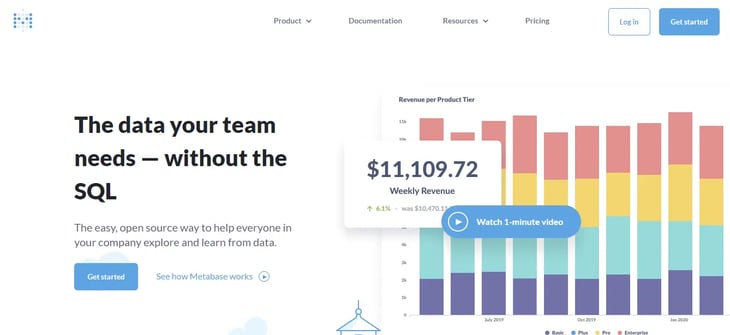
An open source BI tool developed in Java. Basic functions such as dashboard display function and OLAP analysis can be used for free. If you want to use more advanced functions such as single sign-on using SAML or JWT and audit functions, please apply for the paid version.
General open source BI requires knowledge of the source code to install, but Metabase can be started immediately simply by downloading and launching the “jar file”. The ease of implementation is a big advantage.
| PAID VERSION | AVAILABLE: PLEASE INQUIRE FOR PRICE |
|---|---|
| Main function | Dashboard OLAP Analysis SQL Interface Query Builder |
| Mode of introduction | Open Source |
Grafana
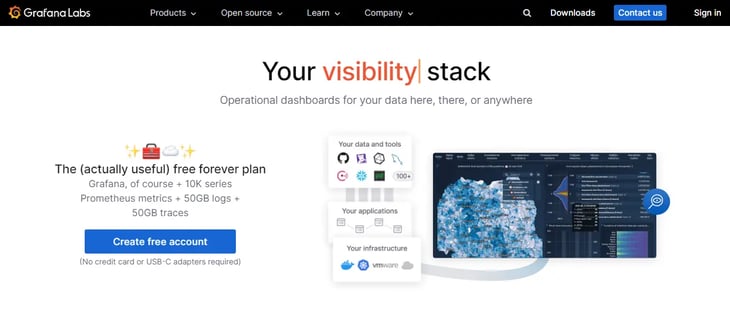
A BI tool with a 14-day free trial. During the free period, you can use the features of the “Cloud Pro Plan” at no cost. It is characterized by being able to work with more than 30 types of data sources, including MySQL and PostgreSQL.
User authentication is possible by linking with LDAP and ActiveDirectory. This is useful when you want to increase the security of tools by granting viewing/editing privileges to each user or group.
| PAID VERSION | CLOUD PRO PLAN: $49/MONTH + USAGE CLOUD ADVANCED PLAN: INQUIRY REQUIRED |
|---|---|
| Main function | Dashboard data source linkage user management |
| Mode of introduction | Open Source |
[Paid version] 6 recommended BI tools

If you try a free BI tool and feel that it lacks features, consider a paid BI tool with more advanced functions. Here, we will introduce the following 6 types of paid BI tools.
| NAME | RATE PLAN | MAIN FUNCTION | MODE OF INTRODUCTION |
|---|---|---|---|
| Tableau | Viewer: 22,000 yen/year Explorer: 60,000 yen/year Creator: 102,000 yen/year *Cloud version above |
Automatic reporting Dashboard Data source linkage AI analysis Map Automatic map creation |
On-premises cloud |
| La Keel BI | Inquiry required | Automatic reporting Dashboard Original design construction Integrated database Excel linkage |
On-premises cloud |
| Domo | Inquiry required | Automated ReportingDashboardChat & AlertsPredictive ModelsAnalyticsAPI Integration |
Cloud |
| Sisense | Inquiry required | Embedded automated reporting dashboard AI analytics charts |
On-premises cloud |
| Yellowfin | Inquiry required | Automated Reporting Dashboards Insights Analytics Signals & Alerts |
On-premises cloud |
| Actionista! | Inquiry required | Automated Reporting Dashboard OLAP Analysis Japanese Support |
Cloud |
Tableau
It is a paid BI tool that has a reputation for its easy operability. In addition to creating reports with just a click of the mouse, you can quickly create dashboards of data extracted from all angles . It is attractive that even those who do not have specialized technology can use it with confidence.
The dashboard has functions such as filtering and highlighting, and you can change the format to your liking while searching for the desired information. More than 20 types of charts, such as pie charts, bar charts, and scatter charts, are available for more flexible data analysis.
| RATE PLAN | [ON-PREMISE VERSION] VIEWER: ¥18,000/YEAR EXPLORER: ¥51,000/YEAR CREATOR: ¥102,000/YEAR [CLOUD VERSION] |
|---|---|
| Main function | Automatic reporting Dashboard Data source linkage AI analysis Map Automatic map creation |
| Mode of introduction | On-premises cloud |
LaKeel BI
A variety of useful templates are available for each task , such as management analysis and personnel quantitative analysis . The advantage is that you can easily start analysis just by setting the necessary data, so even those who use BI tools for the first time can use it with confidence.
The UI is also devised for beginners. For example, when creating a report, all you have to do is drag and drop. Created reports can not only be viewed on a web browser, but can also be output in Excel or PDF format, making them highly versatile, such as for sending by e-mail or making proposals during business negotiations.
| RATE PLAN | INQUIRY REQUIRED |
|---|---|
| Main function | Automatic reporting Dashboard Original design construction Integrated database Excel linkage |
| Mode of introduction | On-premises cloud |
Domo
If you want to extract data from dozens of tools like CRM (customer relationship management) and SFA (sales force automation), Domo is for you. Domo works with over 500 data sources to bring all your data together in one dashboard.
The charts you can create have their own name, “cards”. After creating one card, it can be further categorized and displayed as multiple cards, which is effective for multifaceted analysis. It’s also nice that the cards you create are automatically optimized for mobile.
| RATE PLAN | INQUIRY REQUIRED |
|---|---|
| Main function | Automated ReportingDashboardChat & AlertsPredictive ModelsAnalyticsAPI Integration |
| Mode of introduction | Cloud |
Sisense
It is a paid BI tool from Israel that assumes a huge amount of data analysis.
Large companies with large amounts of data need ETL to format the data and DWH (data warehouse) to store the information in order to use the BI system, and this product incorporates both. It is The advantage is that you can reduce the introduction and development costs of ETL and DWH .
It is also characterized by its own “In-Chip engine”. By optimizing CPU processing, you can speed up large amounts of data collection and analysis work.
| RATE PLAN | INQUIRY REQUIRED |
|---|---|
| Main function | Embedded automated reporting dashboard AI analytics charts |
| Mode of introduction | On-premises cloud |
Yellowfin
It is a paid BI tool with excellent outlier detection and analysis functions. If an abnormal value is found in fixed-point observation data, the alert function notifies you. When you want to analyze the causes of abnormal values, the insight function automatically verifies them, so even on-site personnel who lack knowledge and experience can easily utilize the data.
It is also characterized by adopting security that allows detailed settings. Detailed permissions can be set for each task, such as report creation permissions and dashboard usage permissions.
| RATE PLAN | INQUIRY REQUIRED |
|---|---|
| Main function | Automated Reporting Dashboards Insights Analytics Signals & Alerts |
| Mode of introduction | On-premises cloud |
Actionista!
A paid BI tool that allows anyone to easily analyze data without the need for a manual. Based on the concept of “a person in charge who does not have specialized knowledge analyzes data by themselves”, it can be intuitively operated by drag and drop in an environment where a web browser can be used.
While there are many BI tools that do not support Japanese, Actionista! supports everything from system notation to support in Japanese. Since all employees can use it with just one license, the advantage is that it is easy to manage the budget.
| RATE PLAN | INQUIRY REQUIRED |
|---|---|
| Main function | Automated Reporting Dashboard OLAP Analysis Japanese Support |
| Mode of introduction | Cloud |
Let’s verify the functions you really need with a free BI tool
BI tools are divided into paid and free ones. Even free tools have basic functions such as dashboard display and report creation, so free BI tools are useful if you want to check the necessary functions before introduction.
However, there is a caveat. If there is a possibility of switching to a paid BI tool in the future, if you select different tools for the free version and the paid version, it will take time to migrate the data. Large companies dealing with huge amounts of data are especially prone to this kind of case. If there is a possibility of switching to a paid version, first select a paid tool and then use the free plan of the same tool to enable smooth data migration.