For those who want to conduct business activities based on data without relying on experience and intuition, we recommend the introduction of BI (Business Intelligence) tools.
Using BI tools, you can automatically aggregate and consolidate data and display reports, dashboards, and simulations that are useful for analysis . It can be used in any department that makes decisions based on data, so it can be used in a wide range of situations such as management, marketing, and sales.
However, many people may have the image that “BI tools are complicated and difficult.” Therefore, in this article, we will explain the functions and mechanisms of BI tools, examples of their use, etc. in an easy-to-understand manner using diagrams and tables.

Table of Contents
- What is a BI tool?
- What BI tools can do | 5 functions
- Utilization scene of BI tool
- Two disadvantages that occur when introducing BI tools
- How to choose a BI tool
- Successful cases of BI tool utilization
- Let’s introduce BI tools and perform data analysis efficiently
What is a BI tool?
A BI (business intelligence) tool is software that integrates and analyzes various data accumulated in a company and is useful for making management decisions and improving sales. Masu. Analysis results can also be reflected in simulations and planning.
It can be used not only in management and sales departments, but also in any department that makes decisions based on data, such as marketing and customer service. The main usage scenes of BI tools are as follows.
- Management: visualization of management indicators, KPI management, performance forecasts
- Marketing: Customer information analysis, area marketing
- Sales: budget management, project management, sales trend analysis
- Manufacturing: Visualization of operation status, optimization of inventory
- Personnel: Visualization of productivity, appropriate allocation of personnel
Background of BI tools attracting attention
According to a survey by IDC Japan , the size of the BI software market in 2020 was 131.3 billion yen, an increase of 8.8% from the previous year. The annual average growth rate from 2021 to 2025 is also projected to be 7.1%, indicating that attention to BI tools is increasing year by year.
BI tools are attracting attention because the importance of information is increasing more than ever . In today’s world where “information” has been added to “people, goods, and money”, which are the resources of a company, the analysis and utilization of data is essential to expand business performance.
As digital technology evolves and people’s behavior patterns and values change, it is becoming difficult to demonstrate superiority with conventional management policies based on experience and intuition. However, the analysis and utilization of data requires skill and manpower, and it is not easy to put it into practice. Therefore, attention is focused on BI tools that can be operated without special know-how.
What is the difference between BI tools and Excel?
Similar to BI tools, Excel can aggregate data and create charts and tables. However, if you try to do all the data collection and analysis work with Excel, the number of man-hours will increase and it will take a huge amount of time.
For example, the “What-iF analysis” function that can predict the future from the imported data is installed in both BI tools and Excel.
Performing what-if analysis in Excel requires manual database and information capture. Also, you cannot import data from files with different formats.
BI tools, on the other hand, can automate all tasks from data collection to analysis data. You can consolidate multiple files in different formats and easily extract data across different departments. No knowledge of functions is required as there is no need to manually create a database.
It can be said that using BI tools is more efficient than Excel when dealing with huge amounts of data or when in-house skills and resources are lacking.
What BI tools can do | 5 functions
The following five functions are available in BI tools.
- automatic reporting
- Dashboard
- OLAP analysis
- data mining
- Simulation and planning
I will explain each function based on its merits.
automatic reporting
BI tools automatically generate reports based on analysis of collected data. You can automate daily reporting tasks, such as creating materials for management decision-making and sales materials for clients.

Reports can be published in formats frequently used in the business scene, such as Microsoft Office and PDF, so there is no need to convert files. In addition, the data that forms the basis of the report is updated daily with the latest information. By automating document creation and information updating, the time required for reporting work can be greatly reduced.
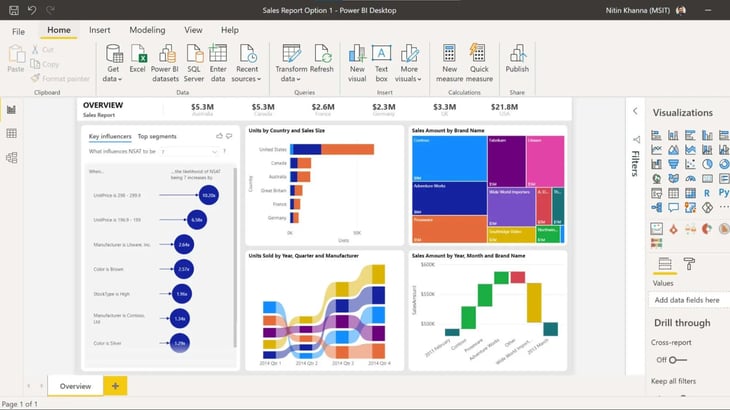
Dashboard
Data imported by BI tools can be visualized by converting it into tables and graphs using the dashboard function. Since the visualized information is displayed on one screen, it leads to a reduction in the time required for data analysis.
For example, it is possible to display a list of data such as “monthly sales”, “sales by product”, “KPI”, etc. that are originally aggregated separately. Displaying it on one screen will lead to more efficient analysis work, such as year-on-year comparisons and target achievement rates for each branch.
You can also output the information summarized in the dashboard and submit it to the customer.
OLAP analysis
OLAP analysis (Online Analytical Processing/multidimensional analysis) is a function that enables real-time analysis of multi-dimensional data such as sales dates, stores, and customer information. Analyze large amounts of data instantly and quickly extract the results you need.
Using OLAP analysis leads to the visualization of data that is difficult to understand about relationships and laws. Analyzing data from a different angle than before has the advantage of being able to discover issues that may have been overlooked.
Visualize data that could not be measured in the past and identify business issues quantitatively. As a result, it will lead to the realization of data-driven management.
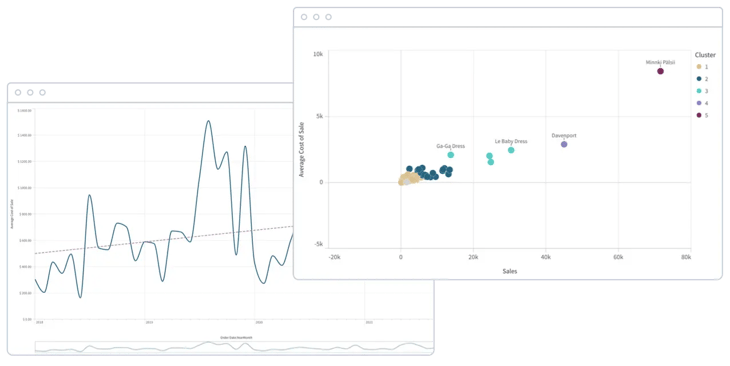
data mining
Using the data mining function of a BI tool enables more advanced data analysis, such as clarifying hidden relationships between each piece of captured data and calculating the probability of occurrence of a certain event.
A typical example of data mining is the anecdote of “beer and diapers”. As a result of analyzing sales data at major US supermarkets, it became clear that people who buy diapers also buy beer at the same time. In this way, the data mining function makes full use of statistics and artificial intelligence to perform multifaceted data analysis.
Simulation and planning
After centrally managing the data collected separately within the company, it automatically predicts sales and profits. Useful for budgeting and forecasting.
For example, you can visualize the impact on sales and profits if the yen becomes stronger than it is today. Depending on the BI tool, there is also a function that notifies you with an alert when the simulation result falls below a certain value.
Utilization scene of BI tool

BI tools can be used in a wide range of situations, such as making management decisions and formulating marketing strategies. Here, we will explain the main scenes where BI tools can be used.
management decision
By using BI tools, you can grasp the latest management information in real time, leading to quick management decisions. For example, you can set business indicators such as the operating margin and break-even point that are emphasized by the company, and track the results as an analysis report at a fixed point. It is also possible to verify sales and profit simulations from multiple patterns using What-iF analysis.
marketing strategy
BI tools can analyze relationships and trends between data, which is also useful when formulating marketing strategies. It is possible to automate the correlation analysis and cross-analysis that have been performed manually, such as “products that are likely to be purchased together with product A” and “changes in sales and profits due to weather”. You can also visualize user needs based on SFA (Sales Support System) data.
Sales analysis
BI tools are also effective for sales analysis. When creating proposals and presentation materials for prospective customers that require persuasiveness, all you have to do is output reports and dashboards automatically analyzed by BI tools. By visualizing the “closed amount” and “estimated amount”, the sales manager can grasp the daily sales performance in real time.
Two disadvantages that occur when introducing BI tools
It is important to anticipate possible risks when using BI tools and prepare for them. Know the disadvantages of the BI tools explained below and understand what points you should be aware of.
Takes time to produce results
Even if you use BI tools to analyze data and implement measures, it may take months or years to see results. It is conceivable that you may make a mistake in judgment because you are in a hurry to find that it is not effective, or you may get frustrated along the way.
Be sure to formulate hypotheses about the data you analyze in advance so that you can move forward with confidence . It is important to create simulations and plans using BI tools and verify multiple patterns with a view to long-term operation.
Time consuming to set
It is a BI tool that can automate data collection/analysis work and reporting work, but in order to display appropriate results, initial settings according to the purpose are required.
For example, to enable the reporting function, data is extracted from the business system and stored in the database of the BI tool. In addition, you must define the types of reports and data to be handled, the aggregation method, the expression method, and so on.
In order to carry out these tasks smoothly, it is necessary to work closely with the information systems department. It’s also a good idea to check the ease of use of the tool with other vendor-provided demonstrations.
How to choose a BI tool

When choosing a BI tool, be aware of the following three points.
- Clarify the purpose of introduction
- Choose the type that suits your purpose
- Choose the right deployment tool for your company
There are various products with different prices and types of BI tools. Find the best BI tool for your company by referring to the points for choosing a tool explained below.
Clarify the purpose of introduction
It is important to clarify the purpose before introducing a BI tool. A common mistake when introducing a new tool is, “Although it was a good introduction, the tool did not match the actual conditions of the site, and no one ended up using it.”
Let’s solidify the purpose while interviewing the management team and the site, such as “I want to grasp the data in management analysis and financial analysis in a timely manner”, “I want to clarify the purchasing group and characteristics of my company’s products and strengthen positioning and targeting”. .
Choose the type that suits your purpose
BI tools are mainly divided into two types: “types with data management functions” and “types without data management functions (analysis-specific types)” .
| EQUIPPED WITH DATA MANAGEMENT FUNCTION | NO DATA MANAGEMENT FUNCTION | |
|---|---|---|
| Features | Equipped with all the functions necessary for BI, including data management and analysis. Because it is multi-functional, it can be used in all situations, such as company-wide use, departmental use, and personal use. | We specialize in data analysis. For small businesses and personal use due to limited functionality. |
| merit | ・ETL and DWH can be used
・Company-wide data integration is possible |
・The UI is simple and easy to use
・Many low-priced products |
| Demerit | ・Data management settings are complicated
・Costs can be high |
・Difficult to mold and create a database
・Separate ETL/DWH introduction fee is required |
The big difference between the two is whether you can use ETL (molding tools) and DWH (data warehouse) functions.
A DWH is like a large warehouse that can store a huge amount of data, and it has the role of accumulating purpose-specific data in chronological order. Data to be stored in DWH is collected from internal systems, but data from multiple core systems such as sales and purchasing systems must be aggregated.
ETL is responsible for the aggregation function. ETL is an abbreviation of “Extract, Transform, Load”, and rewrites (formats) the data groups of multiple core systems into unified rules, and then delivers the data to DWH.
Combining DWH and ETL leads to reduction in development man-hours and realization of high-speed processing, making it possible to efficiently aggregate and analyze even a huge amount of information that spans the entire company.
Therefore, when you want to integrate and analyze data company-wide, BI tools with data management functions are better suited.
Choose the right deployment tool for your company
Let’s check the introduction form of the BI tool in advance. There are two types of deployment: on-premises type and cloud type .
| ON-PREMISE TYPE | CLOUD TYPE | |
|---|---|---|
| Features | Also called “in-house operation”, the software is installed and used on the company’s own server. | Use the service online without installing software. |
| merit | – Easy to customize settings
・It is possible to build your own security |
・Easy to reduce installation cost
・Reduces time and effort during installation and operation |
| Demerit | ・Installation costs tend to be high
– Time consuming to manage |
– May lack flexibility
・Security depends on other companies |
Choose the on-premises type if you value flexibility and security in settings, and the cloud type if you want low cost and ease of use.
Successful cases of BI tool utilization
In order to confirm the effectiveness of more specific BI tools, let’s refer to examples from other companies. Here are two successful cases from Trupanion and SACOS.
Eliminate data inaccuracies and delays (Trupanion)
Pet insurance company Trupanion implemented a BI tool to optimize business decisions.
Insurance services have different pricing and churn patterns for each customer, and it is necessary to monitor sales performance and customer retention progress for each segment. Therefore, we introduced a BI tool so that the collected data can be checked at a glance from the dashboard.
After the introduction, TV monitors displaying KPI dashboards for each department are now hung on the walls of the office.
Managers sit in front of dashboards and see real-time performance of their team and the performance of the entire department. Also, at the end of the day, management can see how the company is performing and make good business decisions.
Integrate internal and external data and renew sales strategy (SACOS)
SACOS, a construction equipment rental company, introduced a BI tool to streamline sales analysis.
Until now, sales activity status data was scattered in the SFA, and sales performance data was scattered in the core system, and could not be effectively utilized for management. Therefore, in-house data is integrated into BI tools. In addition to linking with the core system, we also used Google Analytics, map information, and third-party data for analysis.
The introduction of BI tools has changed the way data is shared, and it has become possible to make appropriate decisions on measures for each business and the behavior of sales employees. The increased use of tools across departments has also resulted in significant efficiency gains in budgeting.
Let’s introduce BI tools and perform data analysis efficiently
By introducing a BI tool, business analysis and financial analysis based on data can be performed without relying on experience and intuition. Although the introduction and operation of BI tools are costly, they can significantly reduce the time required to analyze huge amounts of data, which will lead to cost reductions in the long run.
When choosing a BI tool, it is important to clarify the purpose of introduction in advance, narrow down the necessary functions, and select the BI tool that suits your company. Let’s introduce the best BI tool and perform data analysis efficiently.